Course reports, located under Evaluation in the Control Panel, provides different ways to view information about student activity, content, and course usage.
Note: If a course report includes a large number of users, it can take several minutes or longer for a report to generate. PDF and HTML formats open immediately in a new window. Excel and Word will prompt you to save the file first. To print reports, use the print function in the application window that the report opened in.
Reports are divided into sections and include charts as well as raw data. The sections vary depending on what type of report you run. Generating a report in Excel format does not display charts.
Information about course report types is available in the What Course Reports are available in Blackboard? article.
How to Generate a Course Report
Step 1
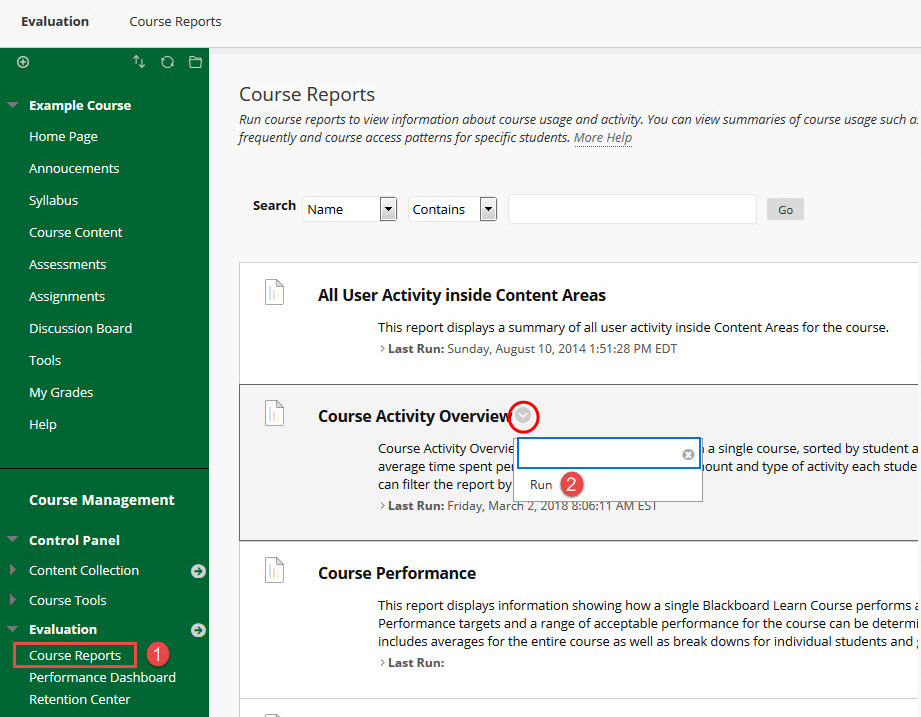
From the Control Panel, select Evaluation and then Course Reports (1).

Step 2
Select the Action Link and then select Run (2) next to the report you want to generate. In this example, Course Activity Overview is selected.

Step 3
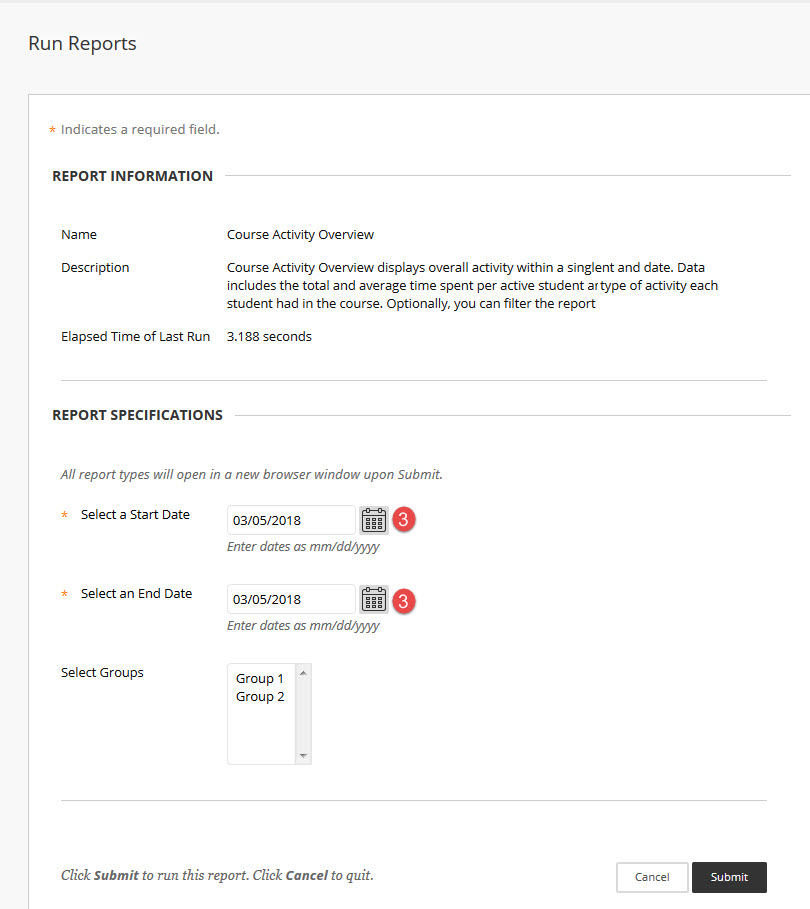
On the Run Reports page, select the Report Specifications (3)(Start Date and End Date) then select Submit to run the report.
Note: Options vary with the type of report and may include the following:
- Output format (PDF, HTML, Excel, or Word)
- Start and end dates
- Ability to select users to include in the report

Step 4
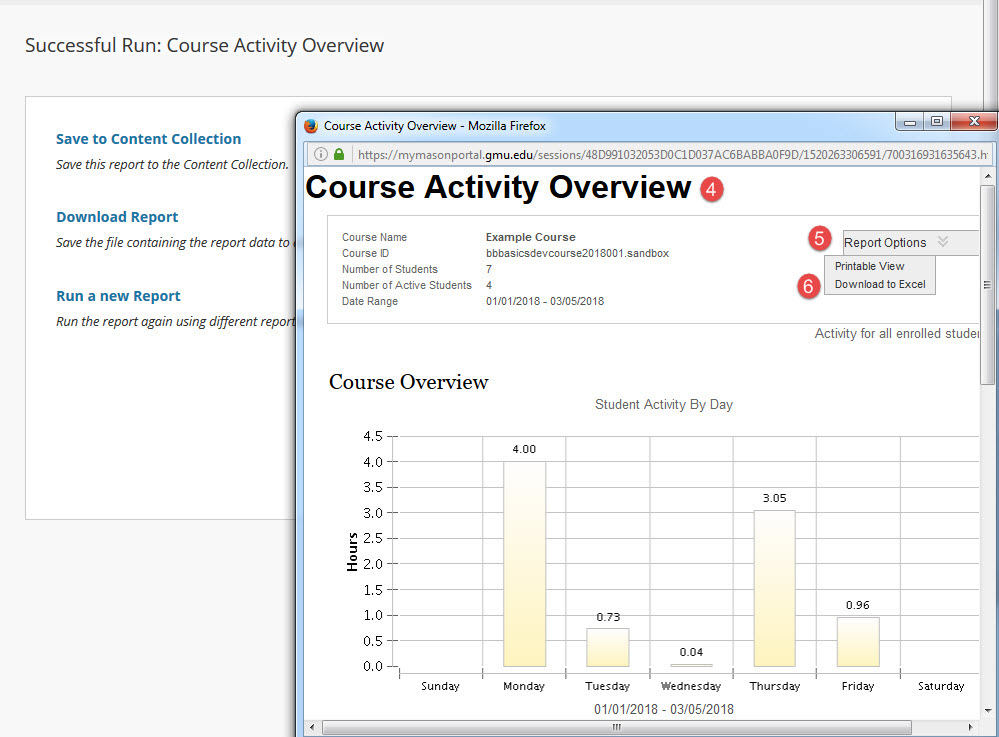
The report file displays in a new window (4). You may need to enable pop-ups for your browser. Report Options (5) allows you to select a Printable View of the report or Download to Excel. Selecting Download Report (6) will download the report to an Excel spreadsheet.

