You can export a MicroStrategy dossier by each page as a whole in PDF format, or export a single visualization (i.e., a Grid, a Bar chart, or a Pie chart) within a page in Excel, PDF, or CSV format. Once exported, the data in the resulting file will become static.
Step 1
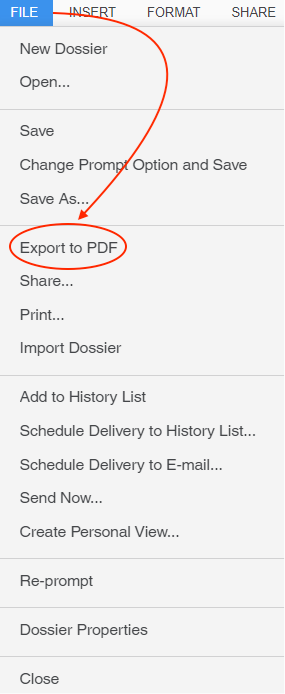
Open the dossier you want to export. Choose File > Export to PDF
Step 2
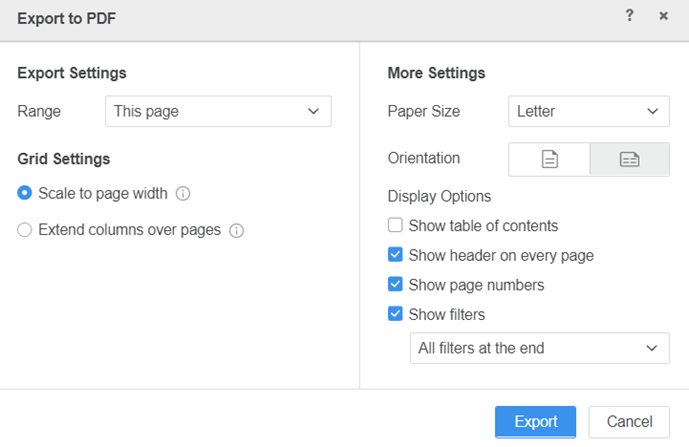
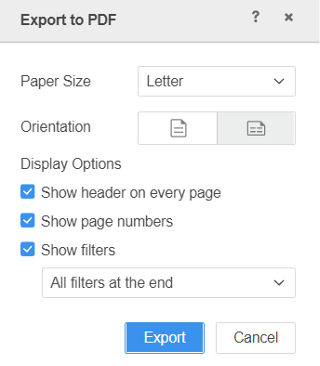
Make your selections in the Export to PDF dialog window.
Export Settings
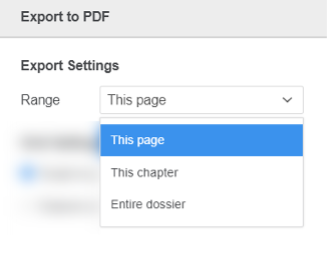
Choose whether you want to export This page, This chapter, or the Entire dossier.
Grid Settings
The Scale to page width option (selected by default) allows your grid visualization to be scaled to fit the page width.
More Settings
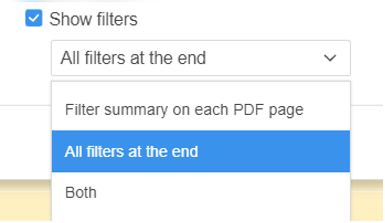
Three of the Display Options are selected by default. However, you can further choose where the filter information is shown in the exported file.
Step 3
Click Export.
How to Export a Single Dossier Visualization
Step 1
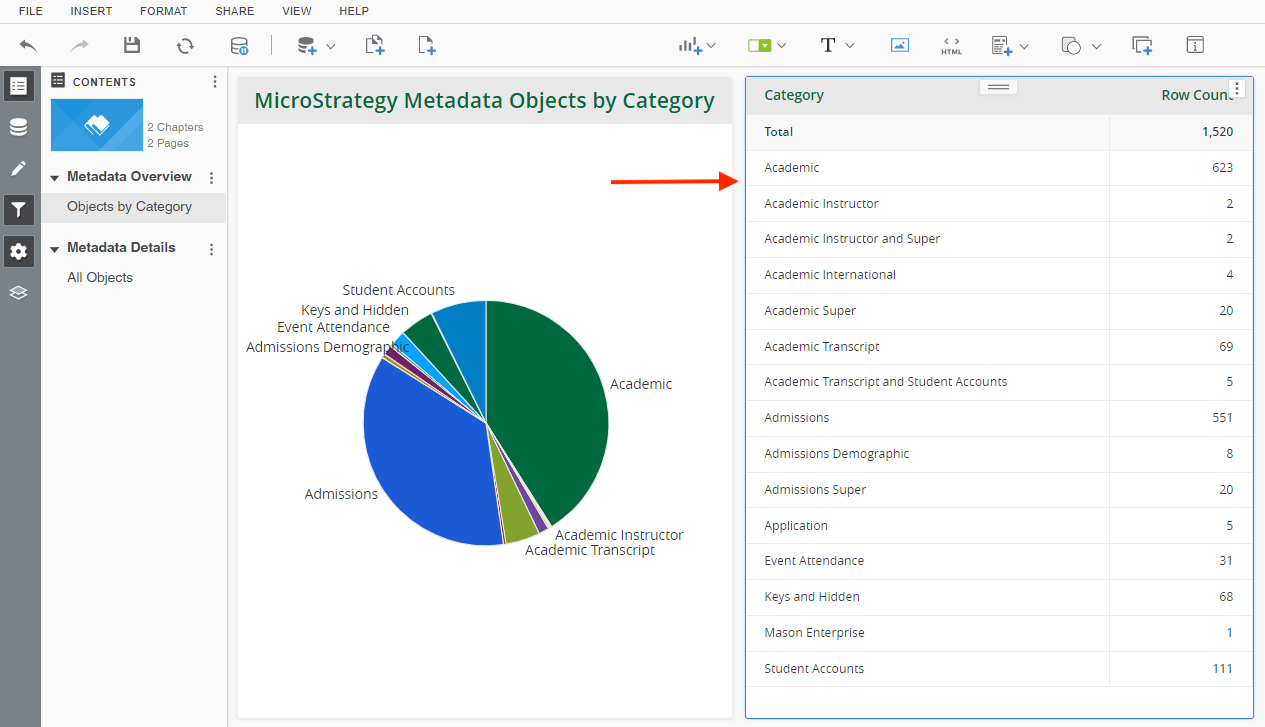
Select the visualization by clicking on it, and a blue border will appear surrounding the visualization.
Step 2
Click the Extra ![]() icon located at the top right corner and a menu will appear. Choose Export > Choose one of the export formats listed.
icon located at the top right corner and a menu will appear. Choose Export > Choose one of the export formats listed.
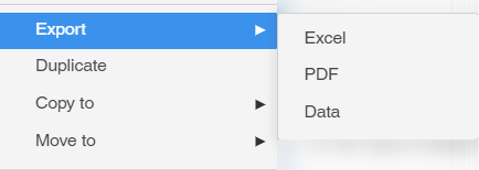
Option 1: Export to Excel
Only available for a grid visualization and will export with formatting.
Option 2: Export to PDF
Exports the selected visualization to a PDF file. A simplified Export to PDF dialog window will appear.
Option 3: Export to Data
Exports the data (underlying data for graph visualizations) in a CSV file.
Note: Currently, exporting a dossier visualization to Excel or Data will execute immediately without additional customization. Unlike exporting a Grid report, it will not provide a choice to include the filter information (the PDF option still has the option for it). Therefore, it is critical for you to take notes of the filter criteria applied if you choose to export a dossier visualization to Excel or Data.
