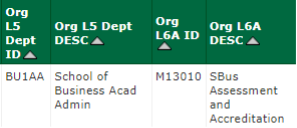
In a Grid report or a Grid visualization for a dossier, by default, multiple attribute forms of an attribute will be displayed together under a merged column header. When exported into an Excel spreadsheet, each attribute form will be in a separate column but they still share one merged column header.

You can choose to display each attribute form as an individual column with its attribute form name as each column header, making the data easier to manipulate in the exported Excel spreadsheet.
Note: The decision to display or not display attribute form names happens at the report level and will affect all attributes on the report.
To Display Attribute Forms as Separate Columns in a Grid Report
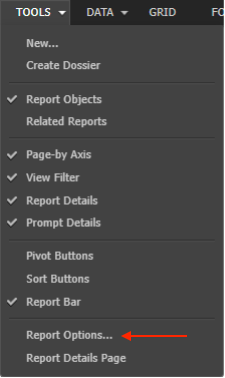
- In the Report Menu Bar on top of the report, click on the ▼ to the right of Tools. You’ll see a drop-down menu. Select Report Options.
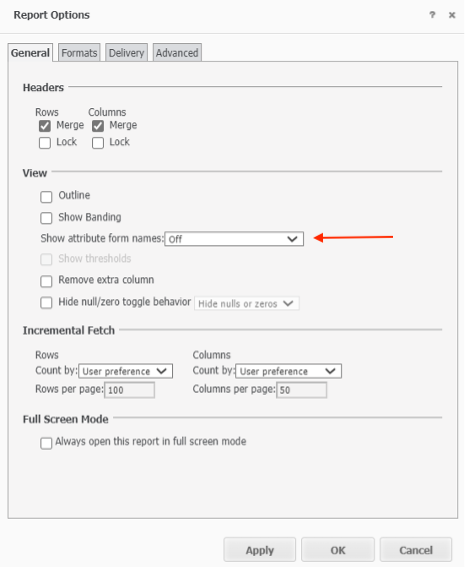
- From the Report Options window, in the General tab, locate Show attribute form names: under the View section. Change its setting from Off to On using the drop-down menu, and click OK.
To Display Attribute Forms as Separate Columns in a Dossier
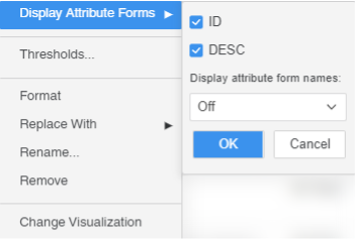
- Right-click on the attribute of interest. From the menu that appeared, click Display Attribute Forms.
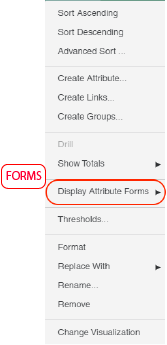
- From the expanded menu, change the setting for Display attribute forms name from Off to On, then click OK.
Last modified: January 30, 2023